
TM Grades Historical
TM Grades Historical 📊⏳
The Token Metrics TM Grade Historical endpoint provides past TM Grade insights for a given cryptocurrency over a selected date range, including the TM Grade score, 24-hour percentage change, Trader Grade change, quantitative grade, buy/sell signal, and momentum status for each date. This enables traders and investors to analyze performance trends and market behavior over time.
Datapoints:
token_id
Token ID for identifying each cryptocurrency (e.g., the Token ID of BTC is 3375).
token_name
The name of the crypto asset (e.g., Bitcoin).
token_symbol
The symbol of the crypto asset (e.g., BTC).
slug
The slug of the crypto asset (e.g., bitcoin).
date
The timestamp of the record, representing the date for which the data is reported.
trading_signal
The current signal value of the strategy, between bullish (1), bearish (-1) or no signal (0).
tm_grade
A short-term trading-focused score (0–100) that combines technical, sentiment, and other market factors.
tm_grade_signal
The buy/sell signal associated with the token’s TM Grade (e.g., Strong Buy, Buy, Neutral, Sell, Strong Sell).
tm_grade_24h_pct_change
Percentage change in TM Grade over the last 24 hours.
tm_trader_grade_24_h_change
Absolute change in TM Grade over the last 24 hours (used for momentum analysis).
quant_grade
Quantitative analysis grade for the token.
momentum
The momentum trend for the token (e.g., Momentum Surging, Gaining Momentum, Holding Steady, Losing Momentum, Momentum Crashing, No Momentum).
token_signal_str
The string representation of the current trading signal (e.g., bullish, bearish, neutral).
app_link
Provides direct access to the Token Metrics token details page, offering comprehensive insights into the token's performance and statistics.
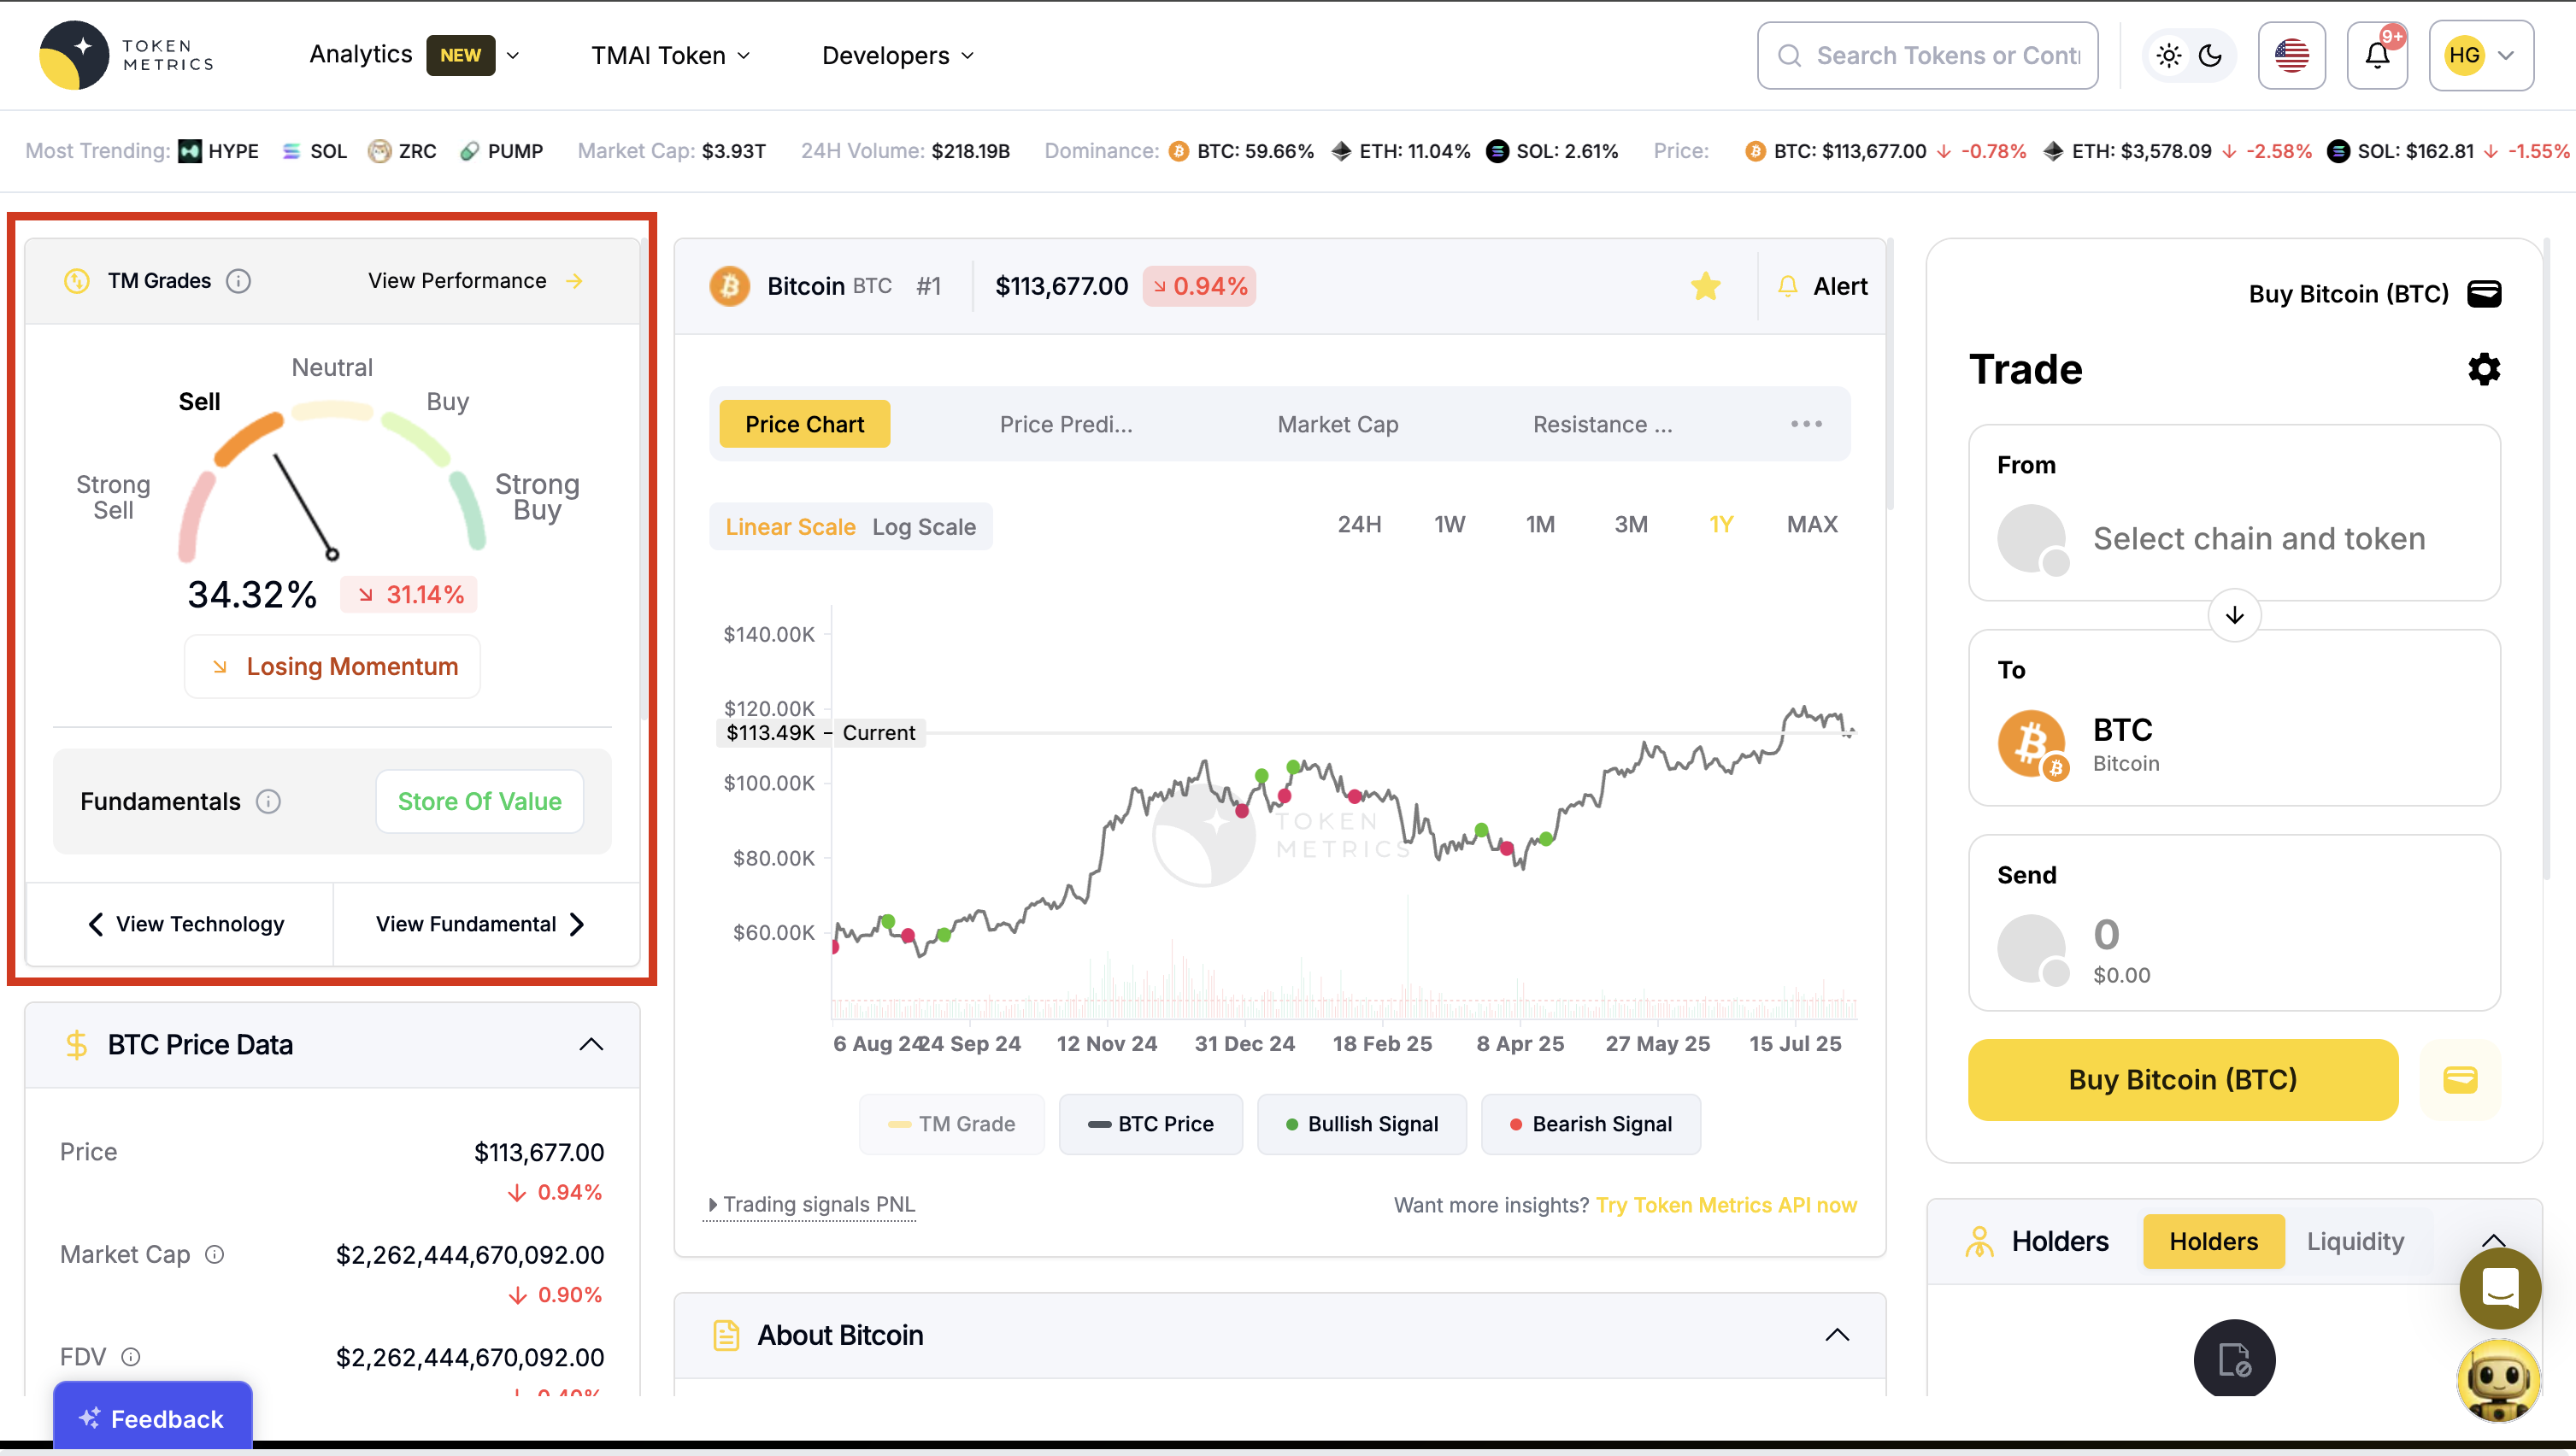
Visualize on Token Metrics Application:
Go to the Token Metrics Token Detail Page under the
TM Gradessection.
Example Use Case:
The TM Grades Historical endpoint is useful for trend analysis. For example:
A trader can compare the TM Grade over the last 30 days to identify bullish or bearish periods.
Investors can track how Fundamental Grade changes over time to spot long-term improvement or deterioration in a project.
Analysts can combine momentum patterns with historical grades to refine trading strategies.
Updated 3 months ago