
Quantmetrics
Quantmetrics 📈
Get the latest quantitative metrics for tokens. Note that Token Metrics pricing data starts on 2019-01-01 for most tokens. More historical data will be available soon.
Parameters: TOKEN_ID, SYMBOL, CATEGORY, EXCHANGE, MARKETCAP, VOLUME, FDV
Datapoints:
TOKEN_ID
Token ID for identifying each cryptocurrency (e.g., the Token ID of BTC is 3375).
SYMBOL
The symbol of the crypto asset (e.g., BTC).
NAME
The name of the crypto asset (e.g., Bitcoin).
DATE
The date of the record.
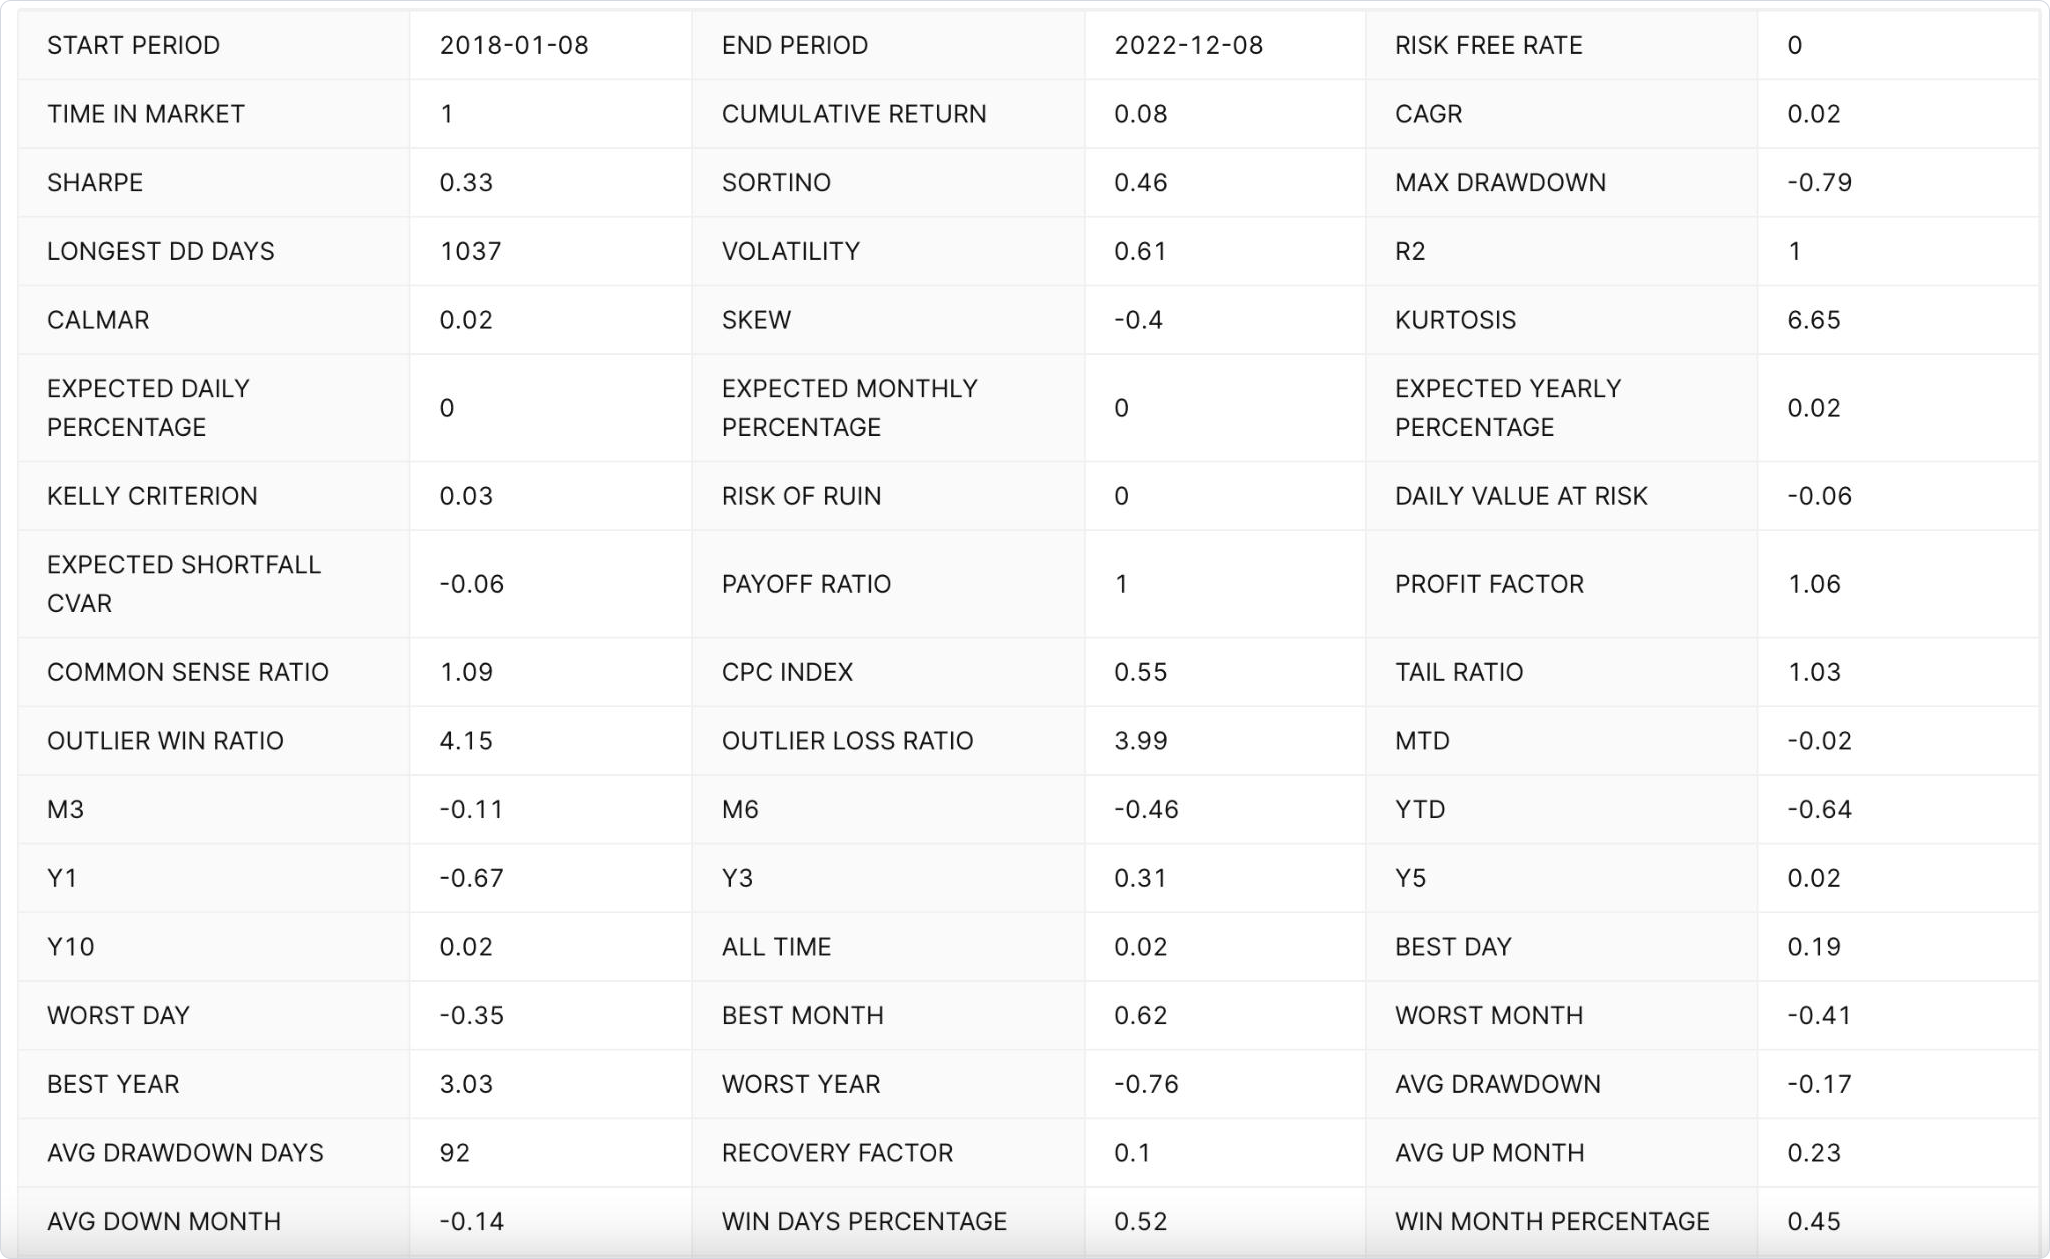
VOLATILITY
The price volatility since the start of the data period can be found by referring to this Link.
ALL_TIME_RETURN
The cumulative return of the asset since inception.
CAGR
The Compound Annual Growth Rate (CAGR) represents the average annual return of an investment over a specified period. Refer to this Link.
SHARPE
The sharpe ratio of the asset, a measure that calculates the average return of an investment portfolio concerning its risk, considering the risk-free rate. It provides a comparison of the performance of an investment to its risk. Learn more about it at the following Link.
SORTINO
The sortino ratio of the asset, a measure of the return of an investment portfolio that considers the downside volatility instead of total volatility. For more information, refer to this Link.
MAX_DRAWDOWN
The maximum decline in the value of an investment portfolio, relative to its peak value, since the start of the data. Visit this Link for more information.
SKEW
Skew measures the asymmetry of a distribution of returns, indicating whether they lean towards higher or lower values than the average.
TAIL_RATIO
Tail ratio compares the size of the far ends (tails) of the distribution, specifically the 95th percentile against the 5th percentile, to assess the risk of extreme losses or gains.
PROFIT_FACTOR
Profit factor is the ratio of gross profits to gross losses over a specified period, indicating the relative profitability of a trading strategy.
KURTOSIS
Kurtosis quantifies the 'tailedness' of the distribution of returns, revealing whether extreme values are more or less common than in a normal distribution.
DAILY_VALUE_AT_RISK
Daily Value at Risk estimates the potential loss in value of a portfolio over a given time frame, based on the likelihood of adverse price movements.
DAILY_RETURN_AVG
Daily return average is the mean of daily returns, providing a simple measure of the average return a trader can expect in a day.
DAILY_RETURN_STD
Daily return standard deviation measures the volatility of daily returns, reflecting how much the return on any given day might deviate from the average daily return.
Visualize on Token Metrics Application:
Go to the Token Metrics Summary Page, on the left side, you will find the
performance metricstab under the Trader section.Screenshot from Token Metrics Application: Bitcoin's Quantitative Metrics.
Example Use Cases:
Monitor the performance of a specific asset or portfolio:
By using our API data, traders can easily monitor the performance of a particular asset or portfolio over time. This allows them to make informed decisions about their investments.Create a custom dashboard:
Our API data can be used to create a custom dashboard that displays the comprehensive market performance of a specific cryptocurrency, such as Bitcoin. With the ability to extract metrics such as "SHARPE", "SORTINO", and "VOLATILITY", traders can create a smart dashboard that updates in real-time and is tailored to their specific needs and preferences.Identify potential trading opportunities:
With our API data, traders can identify potential trading opportunities by analyzing market trends and making informed decisions based on the data provided.Back testing strategies:
Traders can use our API data to back test their strategies and assess their potential profitability and riskiness. The Sharpe ratio and Max Drawdown are two of the most important data points they will look at, as a high Sharpe ratio indicates a highly profitable strategy and a low max drawdown indicates a less risky strategy.
Updated 6 months ago