
Resistance & Support
Resistance & Support 📈
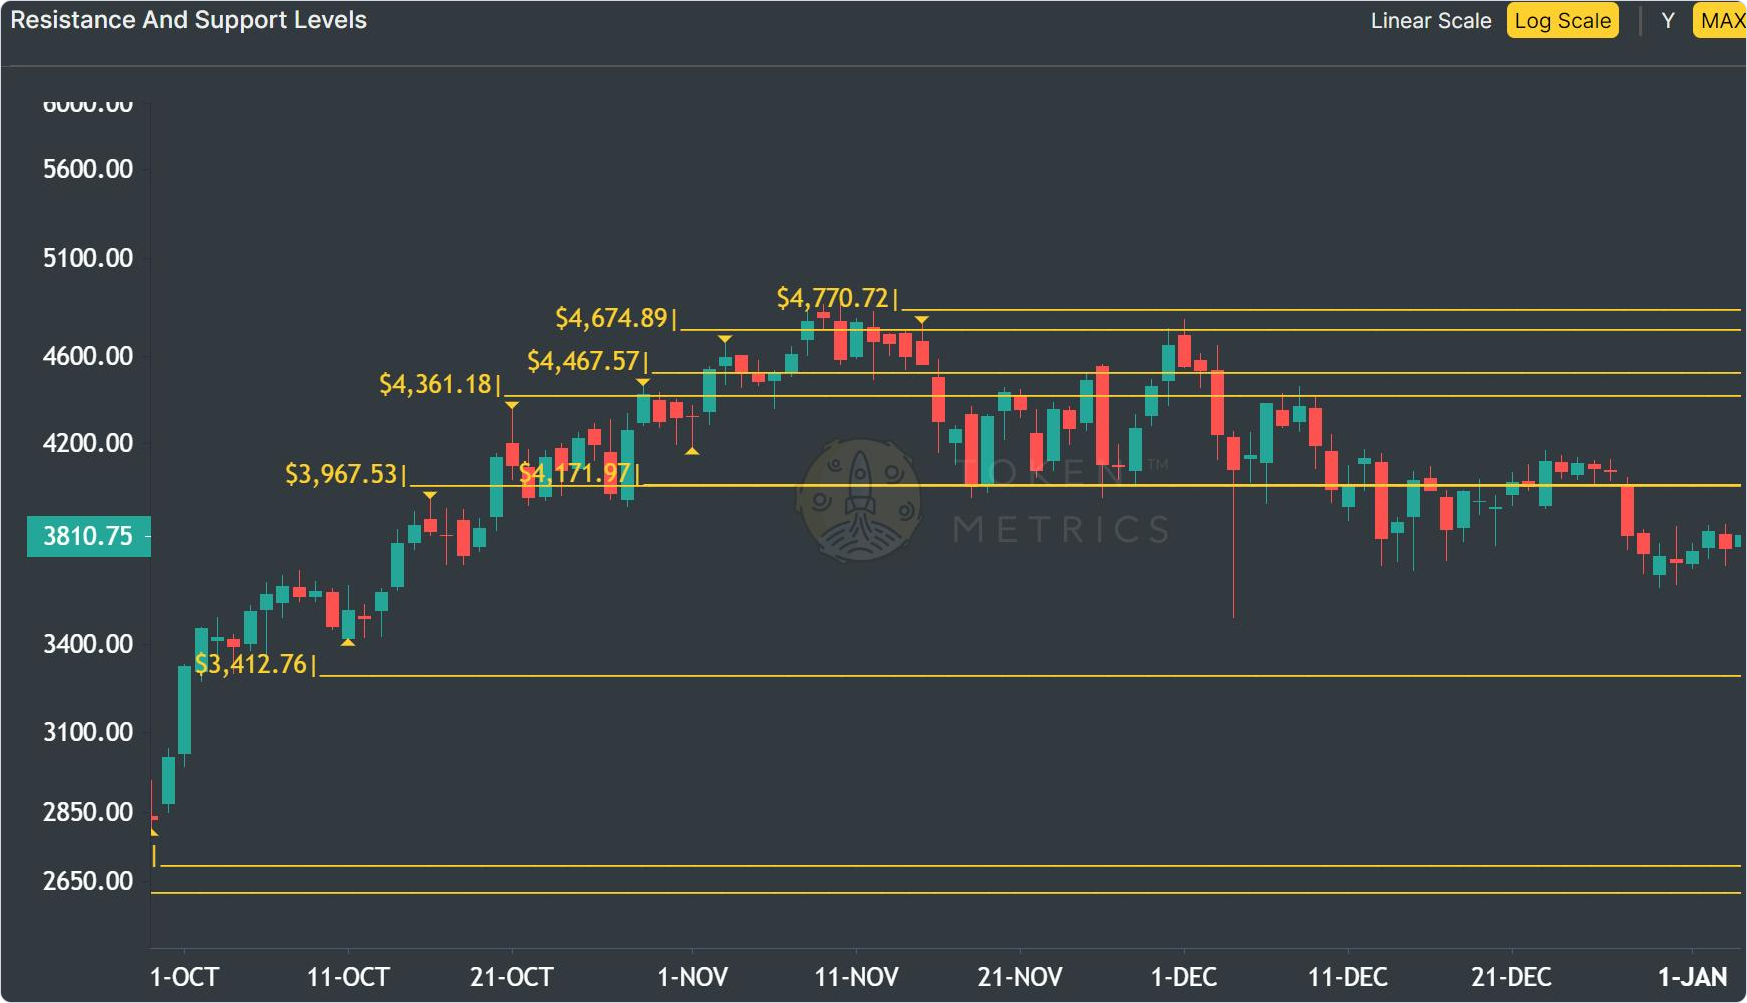
The Resistance & Support endpoint offers historical data on a cryptocurrency's previous support and resistance levels. It gives investors like you a clear insight into the price behavior of a coin. The endpoint always returns all historical levels and accepts a single parameter, the Token ID, to identify the cryptocurrency of interest. The data points include the date, Token ID, and support or resistance level.
Parameters: TOKEN_ID, SYMBOL
Datapoints:
DATE
The date of the price level.
TOKEN_SYMBOL
The symbol of the crypto asset (e.g., BTC).
TOKEN_NAME
The name of the crypto asset (e.g., Bitcoin).
TOKEN_ID
Token ID for identifying cryptocurrency for calculating analysis (e.g., the Token ID of BTC is 3375).
HISTORICAL_RESISTANCE_SUPPORT_LEVELS
The historical list of Resistance and Support levels for the asset.
Visualize on Token Metrics Application:
On Token Metrics Token Detail Page you can see the
Resistance/Support Linesof the asset by selectingResistance and Support Levelson the graph displayed within theTraderview.
Example Use Case:
These levels can be used by traders to figure out good points to take profit and set stop losses.
Updated 6 months ago